CITY OF PHILADELPHIA
Office of Human Resources
Overview
For years now, in almost every city in the country, municipal jobs have gone unfilled, overtime has surged, and important public services have been creaking under the pressure. Philadelphia has proved no exception:
its staffing vacancy rate rose from 5% in Fiscal Year 2018, to 18% in the third quarter of Fiscal Year 2023.
As noted by The Philadelphia Citizen in February 2023, "... Municipal employees are fleeing city government in droves, outpacing administrations’ capacities to fill vacancies, and leaving residents exposed to gaps in basic service provision."
Just a few months later, in its June 2023 Staffing and Overtime Report, the Pennsylvania Intergovernmental Cooperation Authority (PICA), noted that Philadelphia's "City Council [has] worked with the administration to include funding for recruitment and retention initiatives in the FY24 budget." In fact, municipal governments all across the country were doing the same, ramping up efforts to find and keep employees and allocating funds to make it happen.
Unfortunately, despite all the new money and resources, progress was uneven and modest. Between March 2023, and March 2024, the number of open positions - as reported by State and Local Governments (excluding education jobs) in the Bureau of Labor Statistics’ report Job Openings And Labor Turnover – March 2024 - fell by less than 20%, nationally, from about 600,000 to approximately 500,000.
Despite this, our research suggested that Philadelphia was in a strong position to improve its recruitment and retention, improve the perception of the City as an employer of choice, and increase the number of applications from qualified, diverse candidates. We were optimistic that the right strategy could get the right results, even during a time of historically low unemployment and despite private sector wage competition, municipal budget constraints, bureaucratic recruitment processes, and all the other competitive disadvantages we had to contend with.
In fact, all these challenges only served to make our work clear: like discerning consumers who need to be enticed to purchase a product, the talent we wanted had to recognize the value represented by the City, as an employer, in order to consider applying for a position.
Our strategy needed to show people how their personalities, ambitions, and skills overlapped with the operation, aspirations, and culture of the City, by focusing on benefits, impact, and potential more than job features, requirements, and responsibilities. But what people?
Through our research we found that, while more than 70% of the City's workforce was at least 39 years old, more than 46% of the city population was younger than 39. There was a huge, untapped, regional pool of Gen Z and Millennial residents waiting to be called to service in the name of Philadelphia.
Although very diverse, this group shares a strong mission-driven idealism. Gen Z and Millennials are motivated by work that aligns with their values and positively impacts society, and seek employers who demonstrate a commitment to social responsibility, sustainability, diversity, equity, and inclusion. In fact, more than anyone else, these two generations were on the hunt for careers defined by the exact attributes we could speak authentically to.
So, our campaign would focus on marketing
to people, instead of the typical marketing
about jobs that so many other places clung to.
We launched our campaign on July 9th, 2024.

Campaign Video & TV Spot

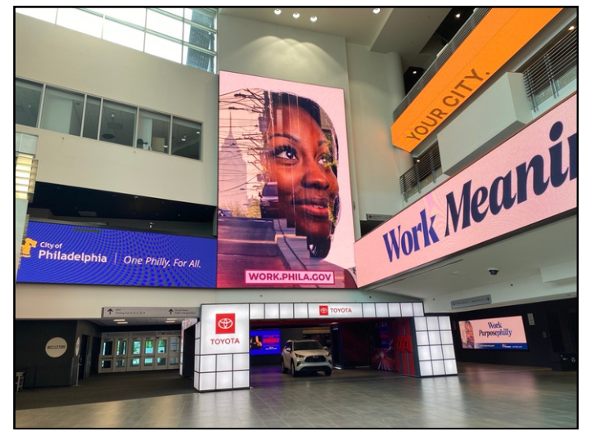
Wells Fargo Center
SEPTA Digital Ads
City Hall
Digital Billboards

The ChallengE
Increase awareness of City job opportunities while educating and expanding awareness about the advantages of working for the City and, in turn, building a diverse candidate population base.
What We Did
OUR AUDIENCE: Gen Z and Millennials
When we compared the largest age group of the city's workforce (39-59 year olds) with the largest age group of Philadelphia’s population, (18-34 year olds) it was clear our campaign would focus on Gen Z and Millennials. Through our research, we found that although very diverse, this group shares a strong mission-driven idealism.
OUR STRATEGY: We Are the City.
For people who believe in a bright future for Philadelphia and want to be a part of making it happen; the City of Philadelphia offers a workplace that sees every person, values them, and wants them to thrive. So that motivated individuals from a variety of backgrounds, across a variety of fields of work, can bring their talent, ambition, energy and dedication here —
to co-create the Philadelphia we dream of — modern, green, clean, safe, accessible and buzzing with excitement.
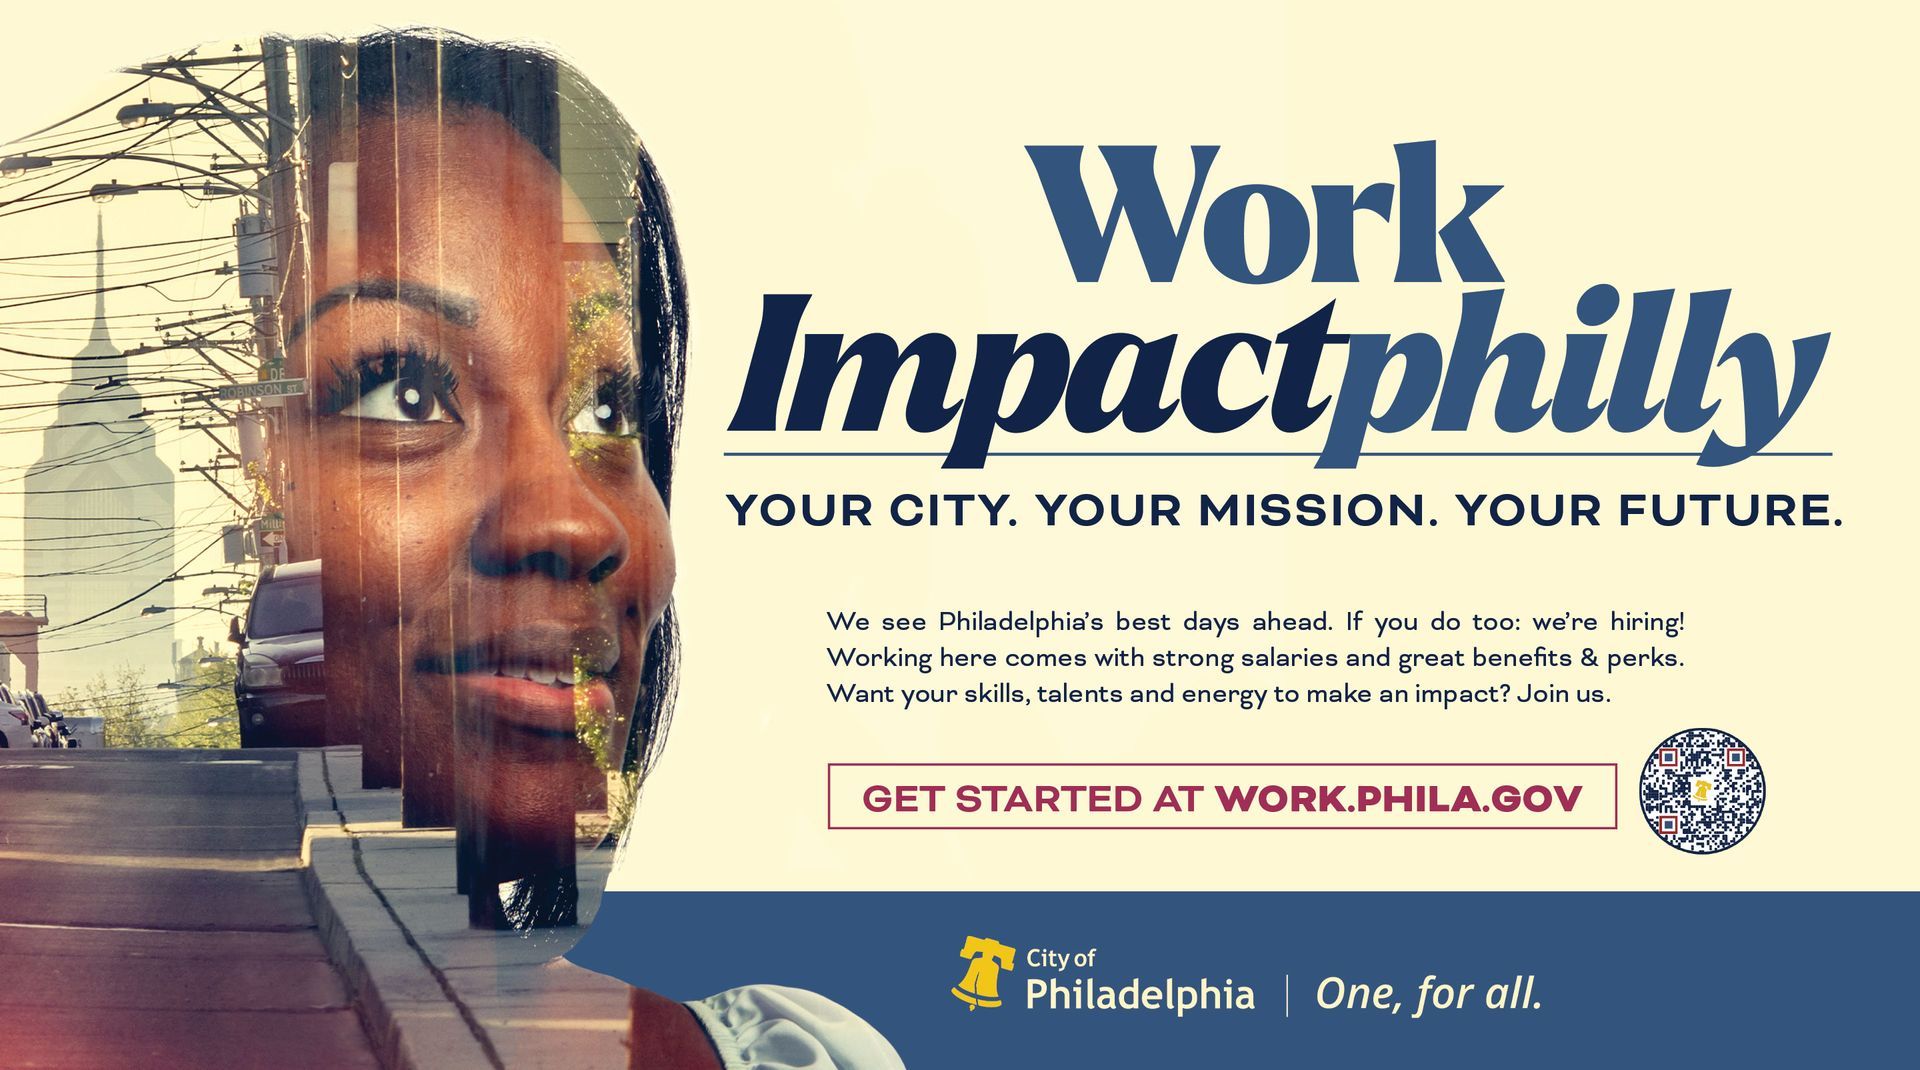
OUR CAMPAIGN: Philly. Fully.
Our campaign grounds itself in the fact that cities are built by people for people. It is about the symbiotic relationship between the City of Philadelphia—and the people who live and work here.
We are the city.
What We Achieved
Since July 8th, the Philly. Fully. campaign website has reported (per GA4) more than 47,000 Users, over 58,000 Sessions, and an Engagement Rate that ranges from 56.23% for 'Organic Search' and 55% for 'Paid Other' to 30.17% for 'Direct Organic' and 28.26% for Organic Social.
The scale of the surge at https://phila.gov/jobs is significant, as the following GA4 data points indicate:
- January 1st to July 7th: the jobs page reported approximately 225,000 Active Users, averaging 1,196 Users a day and reporting a total of 7 days (3.7% of all days) when more than 2,750 User visits were reported.
- July 8th to October 25th: the same page reported approx. 180,000 Active Users, averaging 1,650 Users a day, and reporting 31 days (28% of all days) with more than 2,750 User visits.
To expand on this pre-campaign/post-campaign comparison, the busiest pre-campaign month this year was January, which reported
41,127 Unique Users for a daily average of 1,327. Reporting for post-campaign Unique Users indicate that the daily average since July 8th is running at 122% of the average during January. Put another way:
- January 1st to July 7th: 55.55% of all User visits took place in this 188-day period
- July 8th to October 25th: 44.45% of all User visits took place in this 109-day period
META Ads
Impressions: 180,964
Reach: 47,020
CTR: 3.99%
Digital Display
Impressions: 215,005
CTR: 2.91%
SEM
Impressions: 30,125
CTR: 15.47%
Some Key Results
319,120+
SESSIONS
1,650+
AVG VISITORS PER DAY
313,120
ENGAGED SESSIONS
